Subchapters:
| Plots
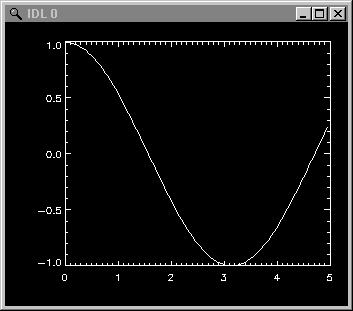
IDL> x = findgen(100)/20. findgen
will generate an array of floating point real from 0 to 99. y will then contain
the IDL> plot,x,y 
Even if you don't have the x values, they will be replaced by a pixel scale: IDL> plot,y
You can easily overplot: IDL>
plot,x,sin(x)
There is a lot of different art of plotting, you can fix the style, the size and/or the color of the drawing lines, set the x- and y-axis range, plot in log-scale, and so on. Just have a look into the manual pages at plot. For example, try the following plotting commands: IDL> x = findgen(200)*10 |
|
IDL courses C. Morisset © 2004 IA/UNAM V 2.2 |