![]()
![]()
![]()
![]()
|
|
Subchapters:
|
Plotting in colorOne of the simplest ways to plot in color is to first define a new color table and then to save the indexes of the color in a variable that can be addressed from everywhere. A system variable will then be used. The following routine can be called when starting IDL (the best would be to include it in the init file). pro my_colors
defsysv,'!col',EXISTS = col_exists
if not col_exists then $
defsysv,'!col',{black : 0, $
white : 1, $
red : 2, $
green : 3, $
blue : 4, $
yellow : 5, $
magenta : 6, $
cyan : 7, $
orange : 8, $
l_green : 9, $
violet : 10,$
turquoise : 11,$
l_blue : 12,$
l_red : 13 $
}
; 0 1 2 3 4 5 6 7 8 9 10 11 12 13
tvlct,[ 0,255, 255, 0, 0,255,255, 0,255,125,125, 0, 0,255],$ ;red
[ 0,255, 0,255, 0,255, 0,255,125,255, 0,255,125, 0],$ ;green
[ 0,255, 0, 0,255, 0,255,255, 0, 0,255,125,255,125] ;blue
end
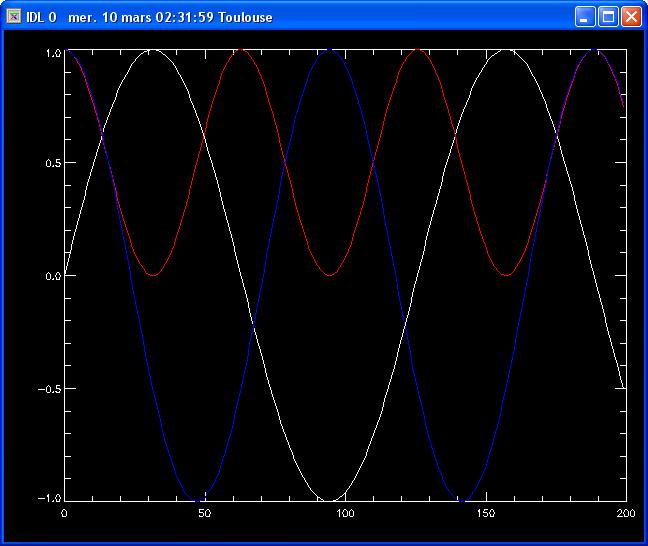
Then, you can plot in colors: IDL> plot,sin(findgen(200)/20.)
|
|
IDL courses C. Morisset © 2004 IA/UNAM V 2.2
|