Home Up Next

Subchapters:

Plots


IDL is a powerful language to draw plots, contours, to view images, to perform projections of 3D data.
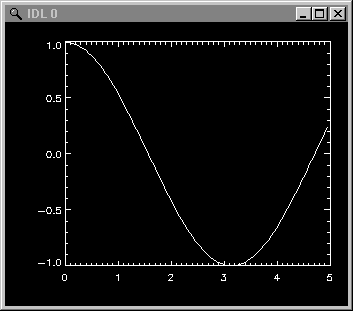
Let's have a vector of sinusoidal function:

        IDL> x = findgen(100)/20.
        IDL> y = cos(x)

findgen will generate an array of floating point real from 0 to 99. y will then contain the
cosinus of 100 numbers form 0 to 5. To plot it:

        IDL> plot,x,y

Even if you don't have the x values, they will be replaced by a pixel scale:

        IDL> plot,y

You can easily overplot:

        IDL> plot,x,sin(x)
        IDL> oplot,x,cos(x)

There is a lot of different art of plotting, you can fix the style, the size and/or the color of the drawing lines, set the x- and y-axis range, plot in log-scale, and so on. Just have a look into the manual pages at plot.

For example, try the following plotting commands:

IDL> x = findgen(200)*10
IDL> y = x^2
IDL> plot , x , y
IDL> plot , x , y , psym = 3
IDL> !p.sym = -5 ; this will affect all the forthcoming plots.
IDL> plot , x , y , /xlog, /ylog
IDL> oplot , x , y^2 , line=3
IDL> plot , x , y , xrange = [0,100]
IDL> plot , x , y , xrange = [0, 97]
IDL> plot , x , y , xrange = [0,97], xstyle = 1
IDL> plot , x[0,20], y[0,20]


IDL courses C. Morisset © 2004 IA/UNAM V 2.2

Home Up Next